 Strategic Resource Intelligence


PAID PROMOTION | Disseminated on behalf of Gunnison Copper Corp. Gunnison Copper Corp. has paid SilverWars LLC total cash compensation of US$[90,000] under a [August 2026-August 2027] investor-relations agreement that includes creating and distributing this post. SilverWars receives no securities compensation and does not hold or trade Gunnison securities. [Full compensation details].
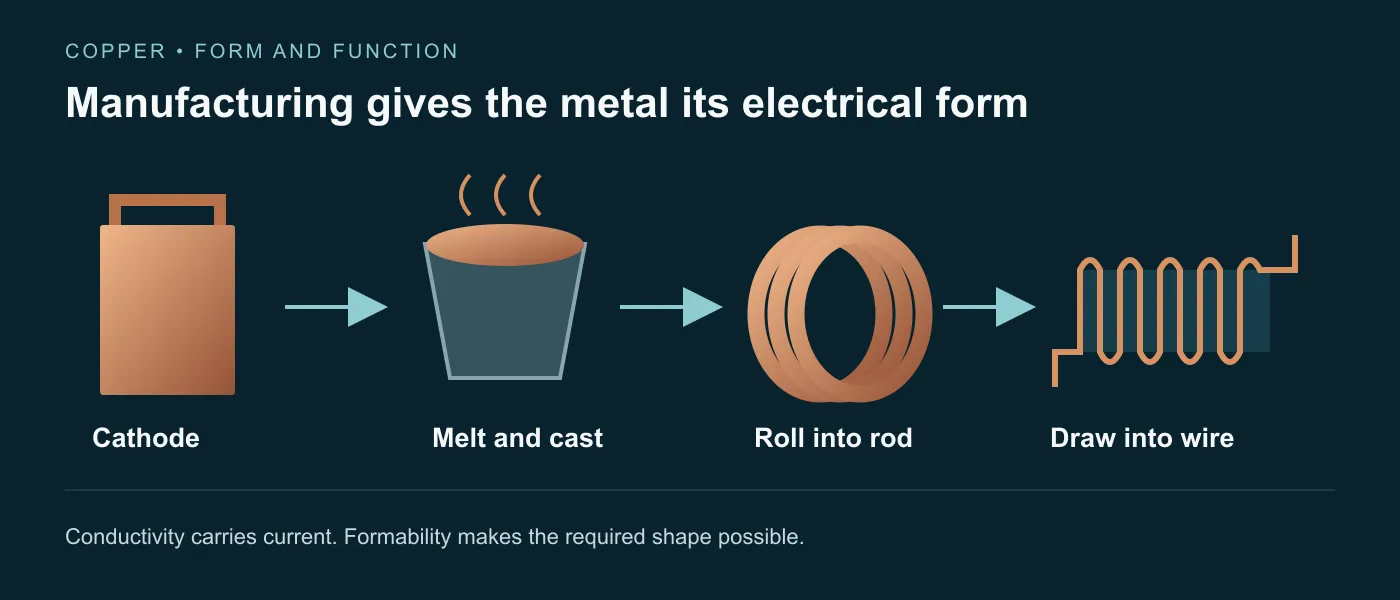
On November 1, 2026, version 2 of Veramark's Chain of Custody Standard takes effect. The framework reaches downstream to manufacturers and end users, where refined metal becomes a component with an electrical job to do. For copper, that journey often includes a furnace. The cathode sheet disappears into a melt before its metal can become the wire inside a cable.
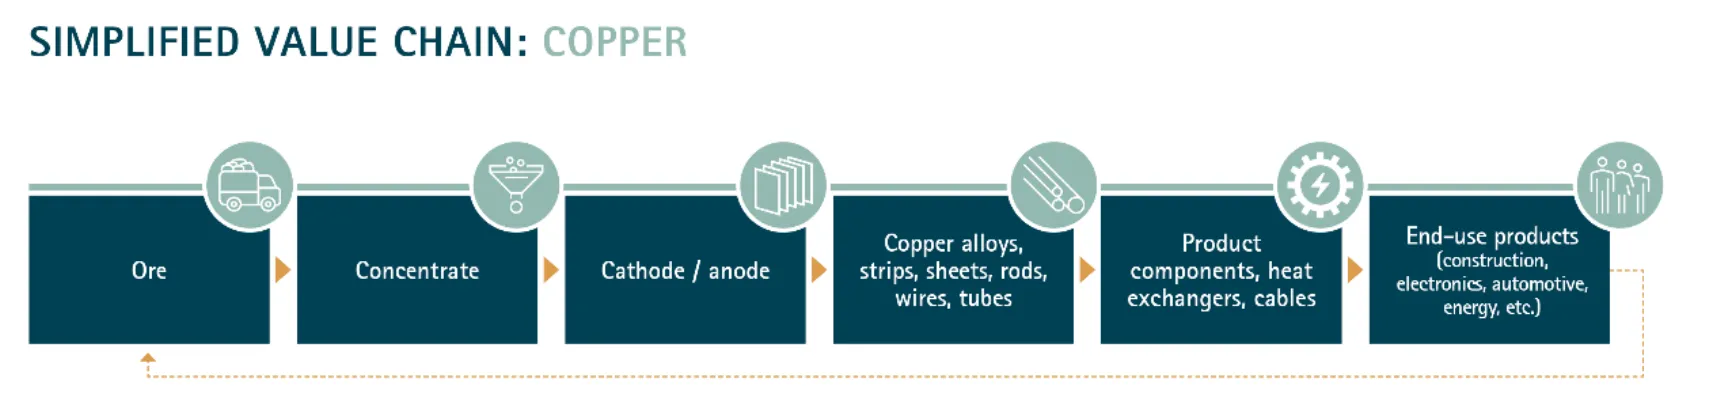
Manufacturing gives copper a new job and a new shape. A sound material record connects those changes to the production history that came before them. The useful connection is between the metal a plant receives and the product it makes, even when those objects look nothing alike. A finished conductor can carry that history alongside its electrical specification. What the history can honestly say depends on what happened during conversion.

A stronger American copper chain
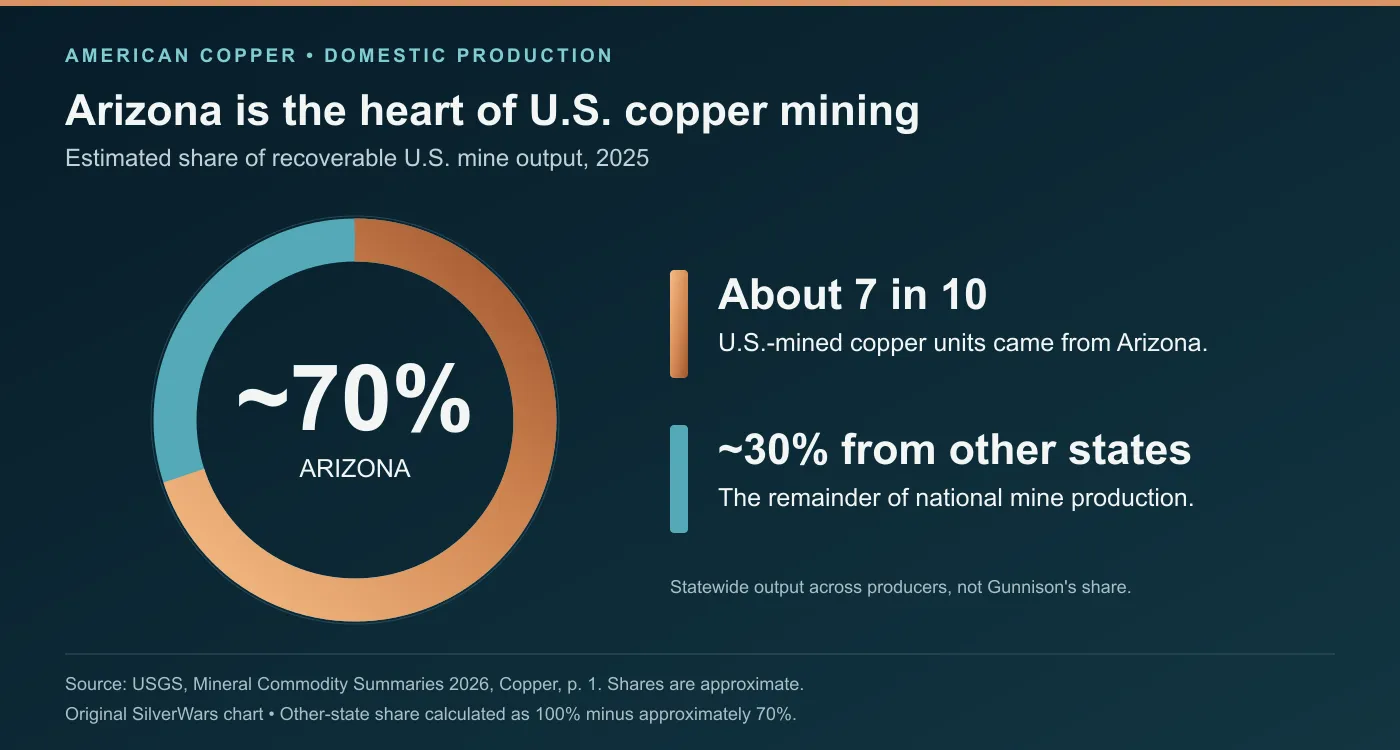
America already has a substantial copper-producing base to build on. USGS estimates that U.S. mines supplied 1 million metric tons of recoverable copper in 2025, with Arizona accounting for approximately 70% of domestic mine output. Expanding that base puts more of the first production step within the same country as the manufacturers that need the metal. The industrial benefit becomes tangible when mined material reaches a usable form and a buyer can qualify it for production.
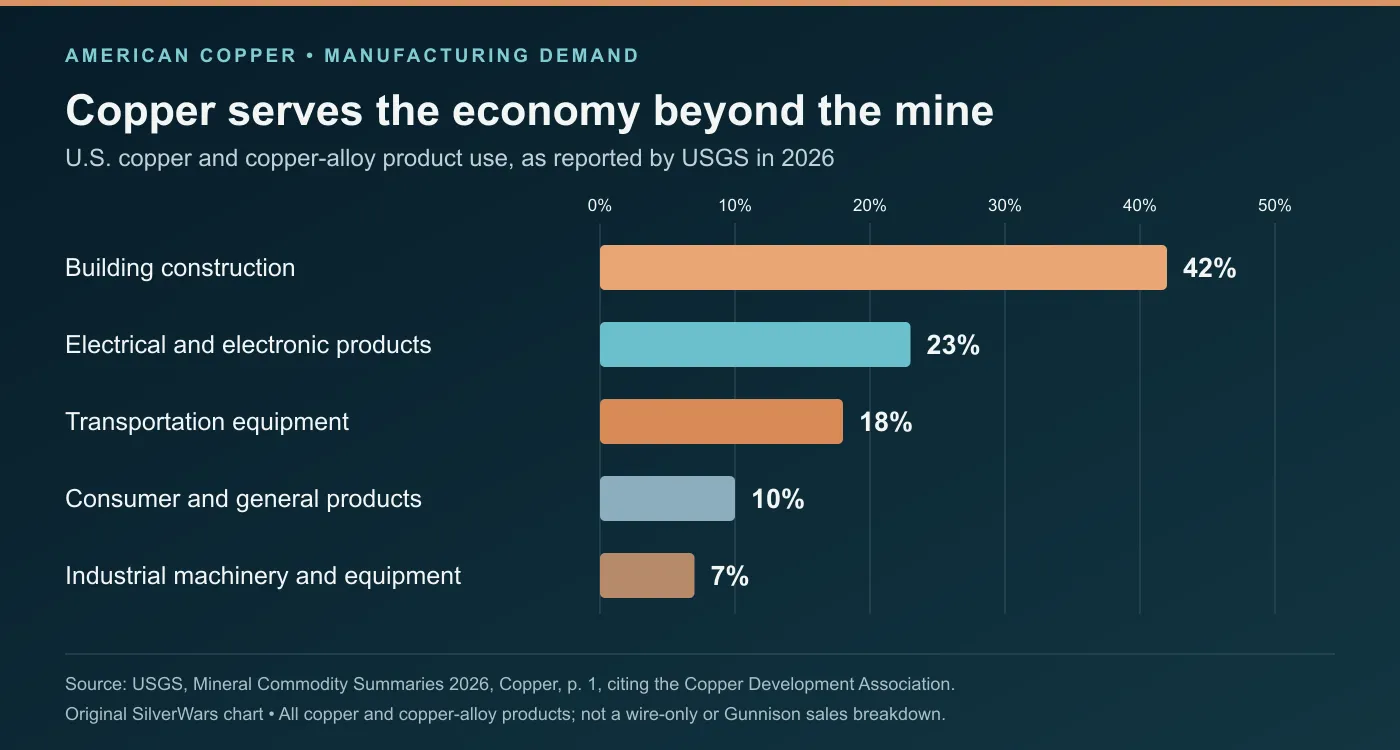
Those manufacturers need more than a mine output figure. USGS identifies 14 U.S. rod mills consuming refined copper and scrap, alongside brass mills, foundries and other users. It reports that building construction accounts for 42% of copper and copper-alloy product use, with electrical and electronic products accounting for 23%. Those categories include uses beyond wire, but they show how broadly the metal enters the economy. For an electrical-equipment buyer, the practical domestic-supply goal is copper that can be converted into the required conductor while preserving a defensible record of its origin. That is how American production can remain an identifiable input to American manufacturing after the cathode is melted.
America still imports much of the copper it uses
There is room for that domestic base to do more. USGS estimates U.S. net import reliance at 57% of apparent copper consumption in 2025. The measure adjusts refined imports and exports for stock changes; it is not a forecast of shortages. Imports and recovered scrap remain part of the supply system. Additional domestic production can widen manufacturers' sourcing options when the material, conversion capacity and delivery terms meet their requirements.
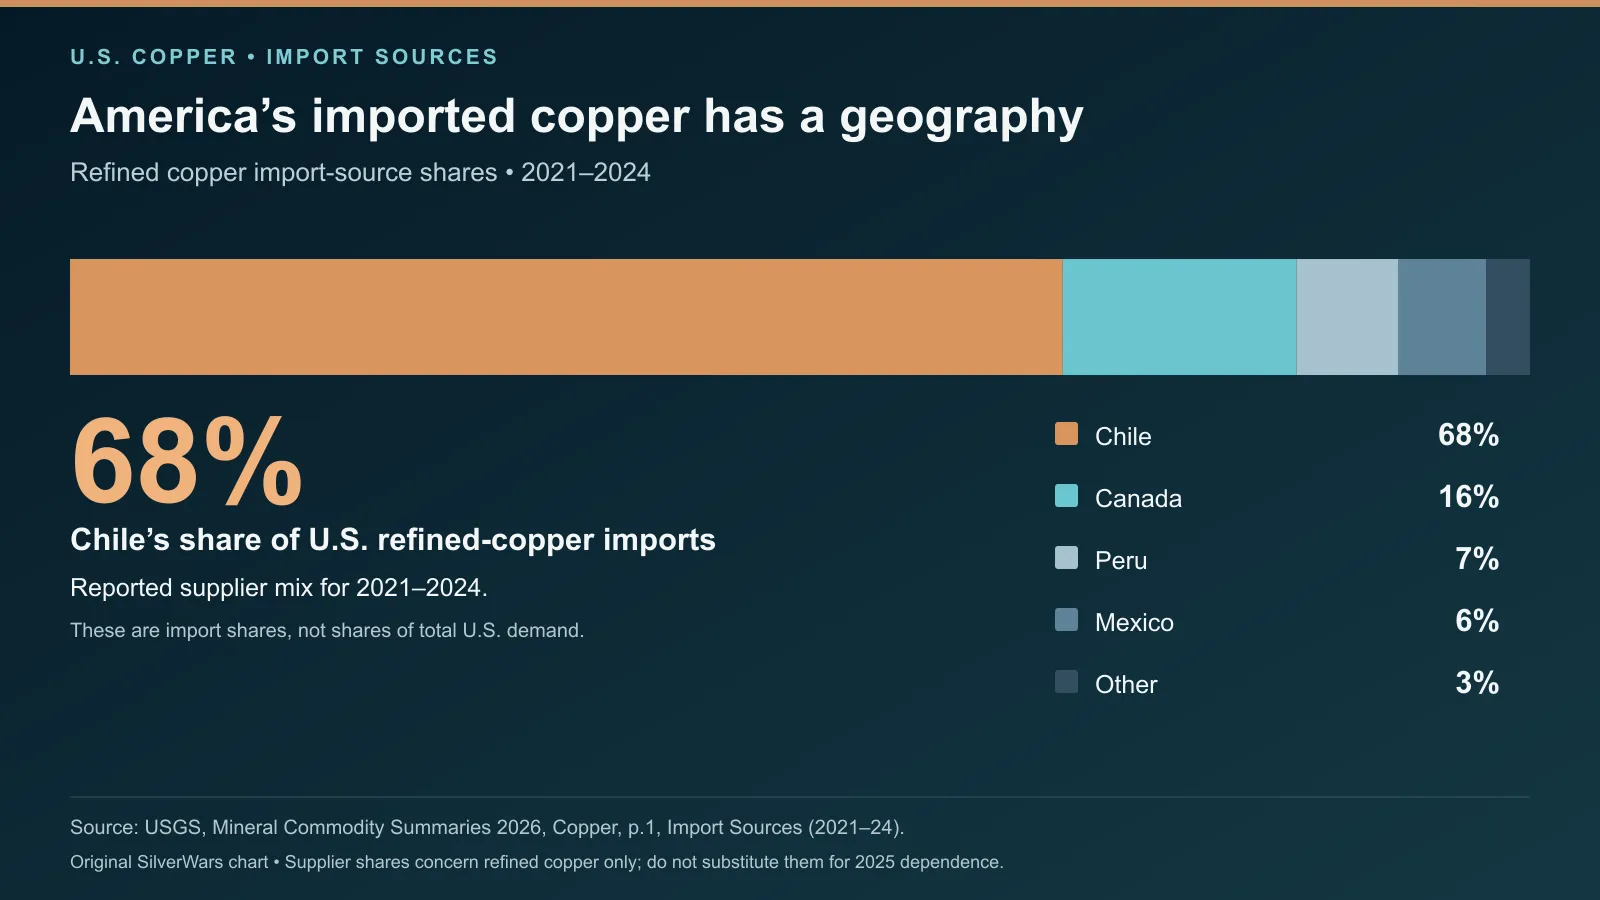
The trading relationships behind that figure have a geography of their own. For 2021–24, Chile supplied 68% of U.S. refined-copper imports, followed by Canada at 16%, Peru at 7% and Mexico at 6%, according to the same USGS summary. Those are historical supplier shares, not a measurement of the mix arriving in October 2026. They show that American manufacturing has drawn heavily on copper refined elsewhere in the Americas. A domestic sourcing strategy can build alongside those trading relationships by adding qualified American output to the available supply.
The scale is substantial: USGS estimates that 1.7 million metric tons of refined copper entered the United States in 2025. Arrivals and factory consumption are different flows. Reported year-end refined-copper stocks rose to roughly 450,000 metric tons, compared with 123,000 a year earlier. Some of the metal arriving during a year can therefore build inventory rather than immediately become a product. That is why the 57% reliance figure incorporates inventory adjustments, and why it should not be read as the imported percentage of every cable or motor. For a manufacturer, the commercial question remains which sources can deliver accepted metal in the required form and production window.
Mining and refining have different world maps
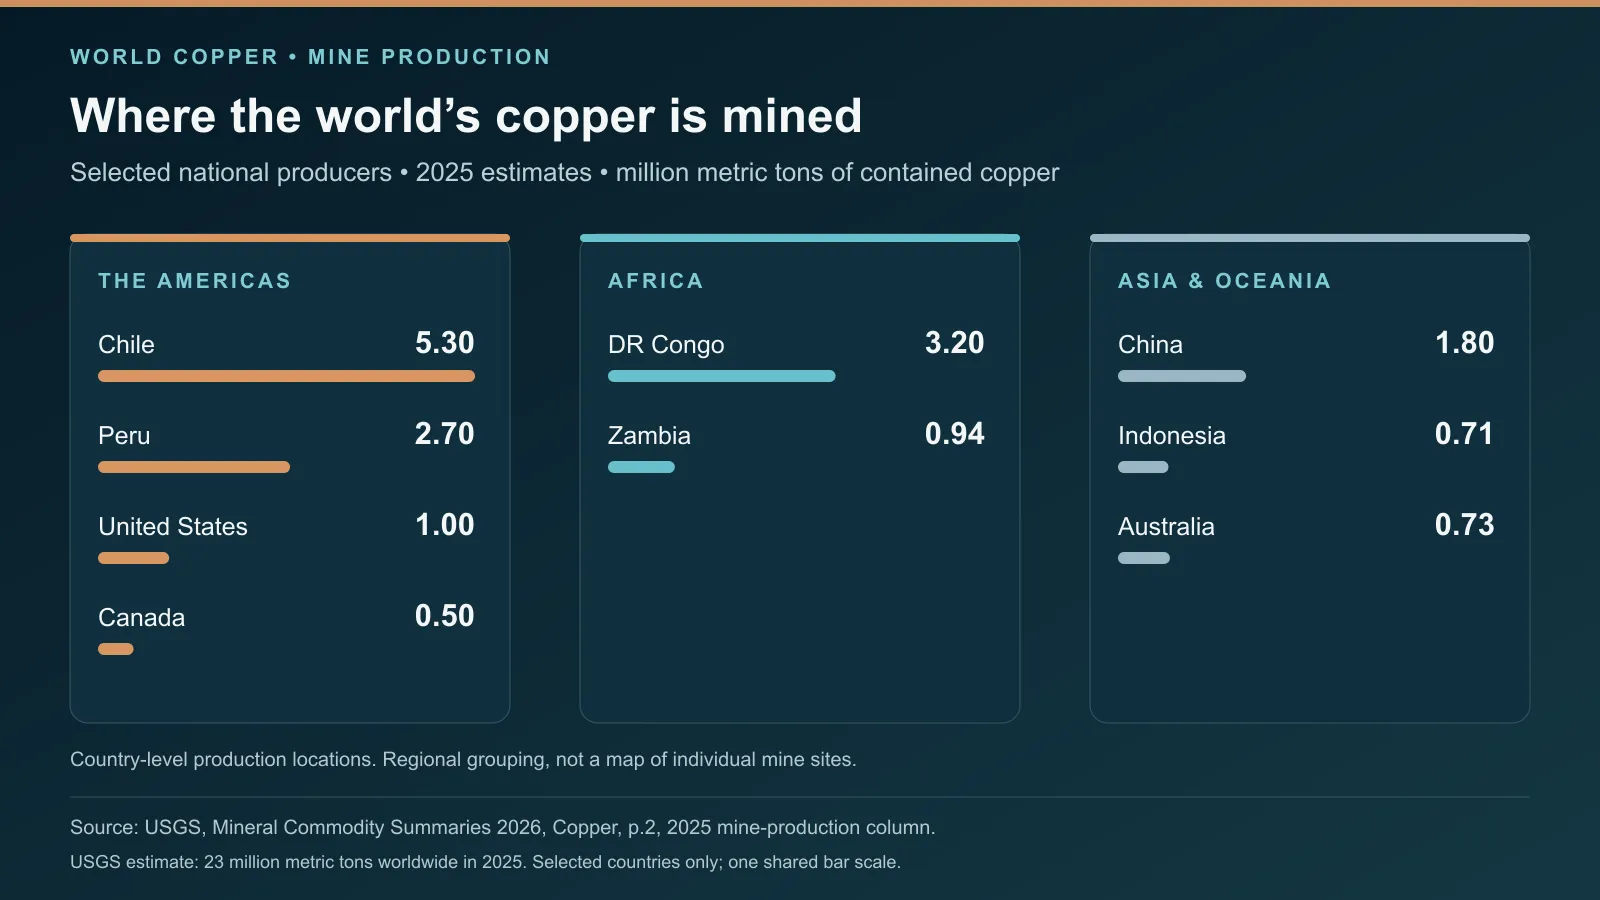
The world produced approximately 23 million metric tons of mined copper in 2025, on USGS estimates. Chile led with 5.3 million, followed by the Democratic Republic of the Congo at 3.2 million and Peru at 2.7 million. Together, those three countries accounted for roughly 49% of the rounded world total. China, Russia, the United States, Zambia, Indonesia and other producers add substantial output across several continents. The United States' 1 million metric tons represented about 4% of world mine production. These figures describe metal produced during a year, not copper remaining underground or capacity available for a new contract.
The geography changes when the question becomes where copper is refined. China produced an estimated 14 million metric tons of refined copper in 2025, approximately 48% of the rounded 29-million-ton world total, compared with 1.8 million metric tons of domestic mined output. Chile, the largest mine producer, refined about 1.7 million metric tons. The United States refined approximately 850,000 metric tons. A country's mine output and refinery output measure different industrial stages; refining can process imported feed and recovered scrap as well as domestically mined material. The two global totals must not be added together as though they represented separate supplies of new copper.
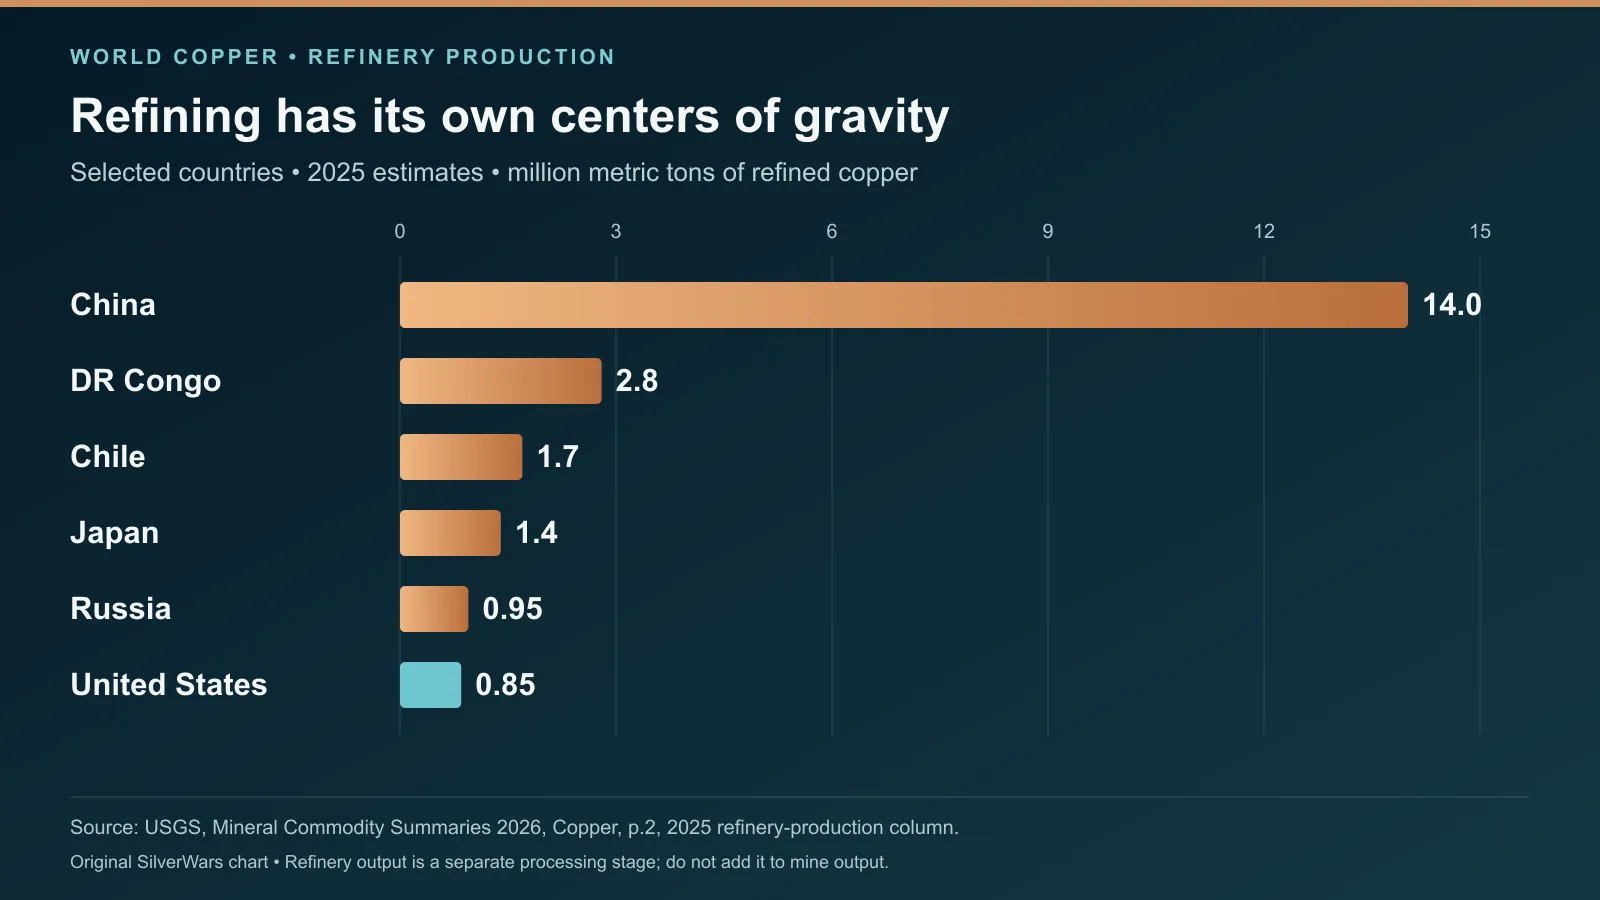
This is why a map of deposits alone cannot tell an equipment buyer where usable copper will come from. Material may be mined in one country, refined in another, and fabricated elsewhere before it becomes a conductor. Each stage has a particular job and needs the right incoming material. China's large refining share does not mean that most U.S. refined-copper imports come from China; the American import figures describe a different flow. The opportunity at home is to support more of the production and conversion work that turns a domestic mineral resource into an accepted manufacturing input.
The metal has to earn its place
Copper's high conductivity provides a low-resistance path for current. At a given current, higher resistance means more heat, so the conductor's properties affect the equipment that uses it. Copper also combines that electrical performance with formability: rod can be drawn into the fine wire needed for windings and cables. A lower-conductivity substitute can require a larger cross-section for the same current, a meaningful tradeoff where space is limited. Aluminum remains useful where weight has greater importance. The material choice follows the equipment's requirements.
The Copper Development Association's wire-metallurgy account explains why chemistry remains important through this work. Dissolved impurities can raise resistivity and alter processing behavior. A source certificate cannot compensate for the wrong conductor properties, and a good conductivity result cannot identify the mine that supplied the copper. Those are different questions about the same useful material.
American supply also returns through the furnace
Domestic copper supply also includes metal recovered after its first use. USGS estimates that old, post-consumer scrap provided 160,000 metric tons of copper in 2025, while about 760,000 metric tons was recovered from new scrap generated during manufacturing. The distinction matters. Used products return metal from earlier demand; manufacturing scrap recirculates metal already moving through today's production system. Recovering that process scrap keeps useful copper in circulation, but it does not create an equivalent quantity of newly mined supply.
Scrap quality also determines the processing work needed before recovered copper can serve another application. A known manufacturing input and a mixed collection of used products present different sorting and chemistry questions. The finished conductor still has to meet its electrical and processing requirements, whichever route supplied the copper. New production and recovery can therefore support the same manufacturing base without being interchangeable at every plant gate. A record that identifies the material entering the melt helps the next producer understand both its usable properties and the origin claim that can follow it.
A new product can retain an old connection
GS1's Global Traceability Standard addresses the point at which one object becomes another. Its transformation requirement links manufacturing inputs with outputs. Applied to copper conversion, the important relationship is the material entering a production run and the rod or wire leaving it. That relationship can be preserved as the output receives a new identifier and moves to another manufacturer. A label on the original cathode alone would stop too early.
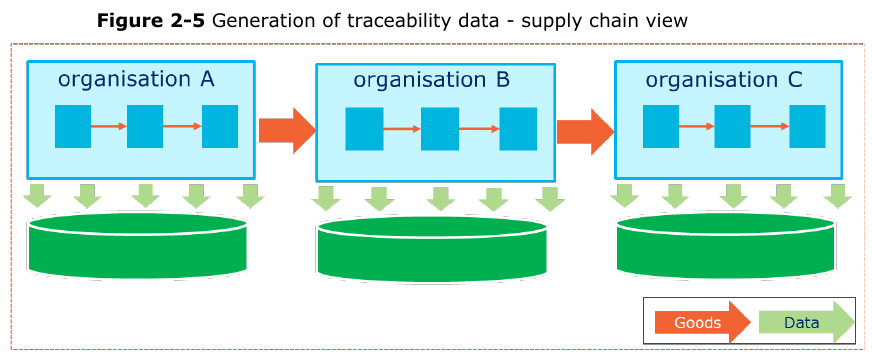
Mixing changes the precision of that connection. A record of a melt containing several inputs can establish the input pool behind its output. It does not sort the finished wire back into the original cathode sheets. This is where a buyer's intended claim matters: identifying a documented production route, supporting a responsible-sourcing claim and asserting a particular mine's metal in a particular product are different statements.
Veramark's framework covers responsible production and sourcing. Its separation model keeps eligible metal apart from other metal through the supply chain. Its mass-balance model permits mixing at a processing stage. Separation can preserve the physical connection to eligible inputs, but eligibility under the scheme is not itself a statement that all copper came from one particular mine. The standard is voluntary; downstream manufacturers can use it as a standalone framework.
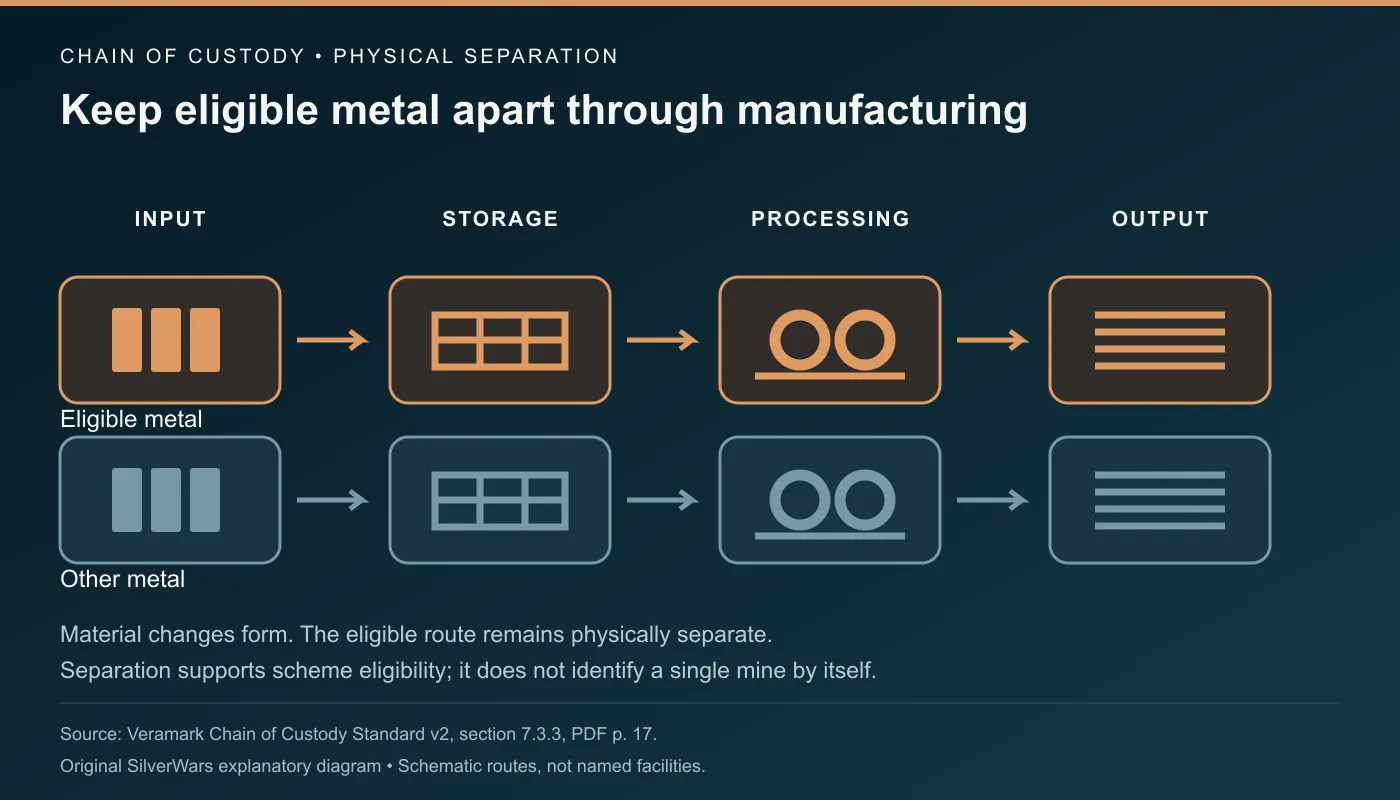
Under version 2, mass-balance claims are constrained by eligible output, with input, output and processing losses reconciled in the accounts. Eligible metal need not be physically present in every product carrying the allocated claim. When previously separated metal enters a mass-balance operation, the claim must reflect that change from that point forward. The record can remain useful through the melt, but its wording has to travel with the accounting model actually used.
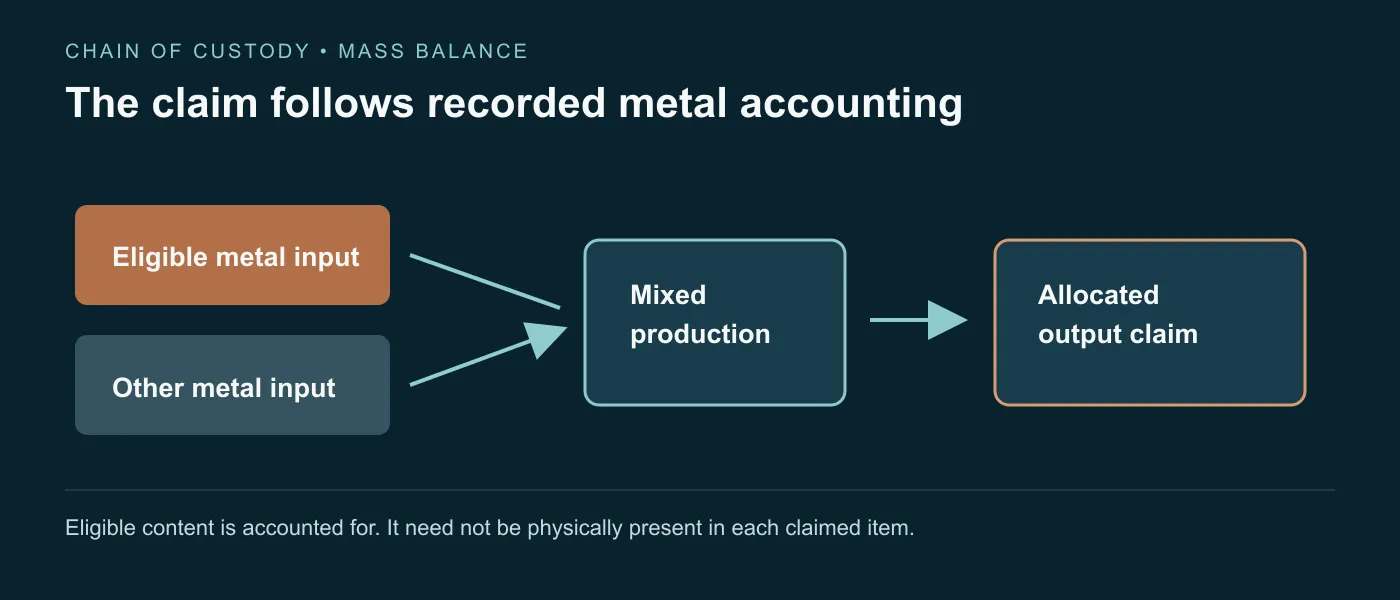
That gives an equipment buyer a more precise comparison than a single box marked “traceable.” If the purchasing requirement concerns physical eligible content, an allocated claim answers a different question. If the requirement permits a supported allocation, treating it as worthless because metal was mixed would discard information the system was designed to preserve. Neither description changes the conductivity the finished conductor must deliver.
A domestic starting product
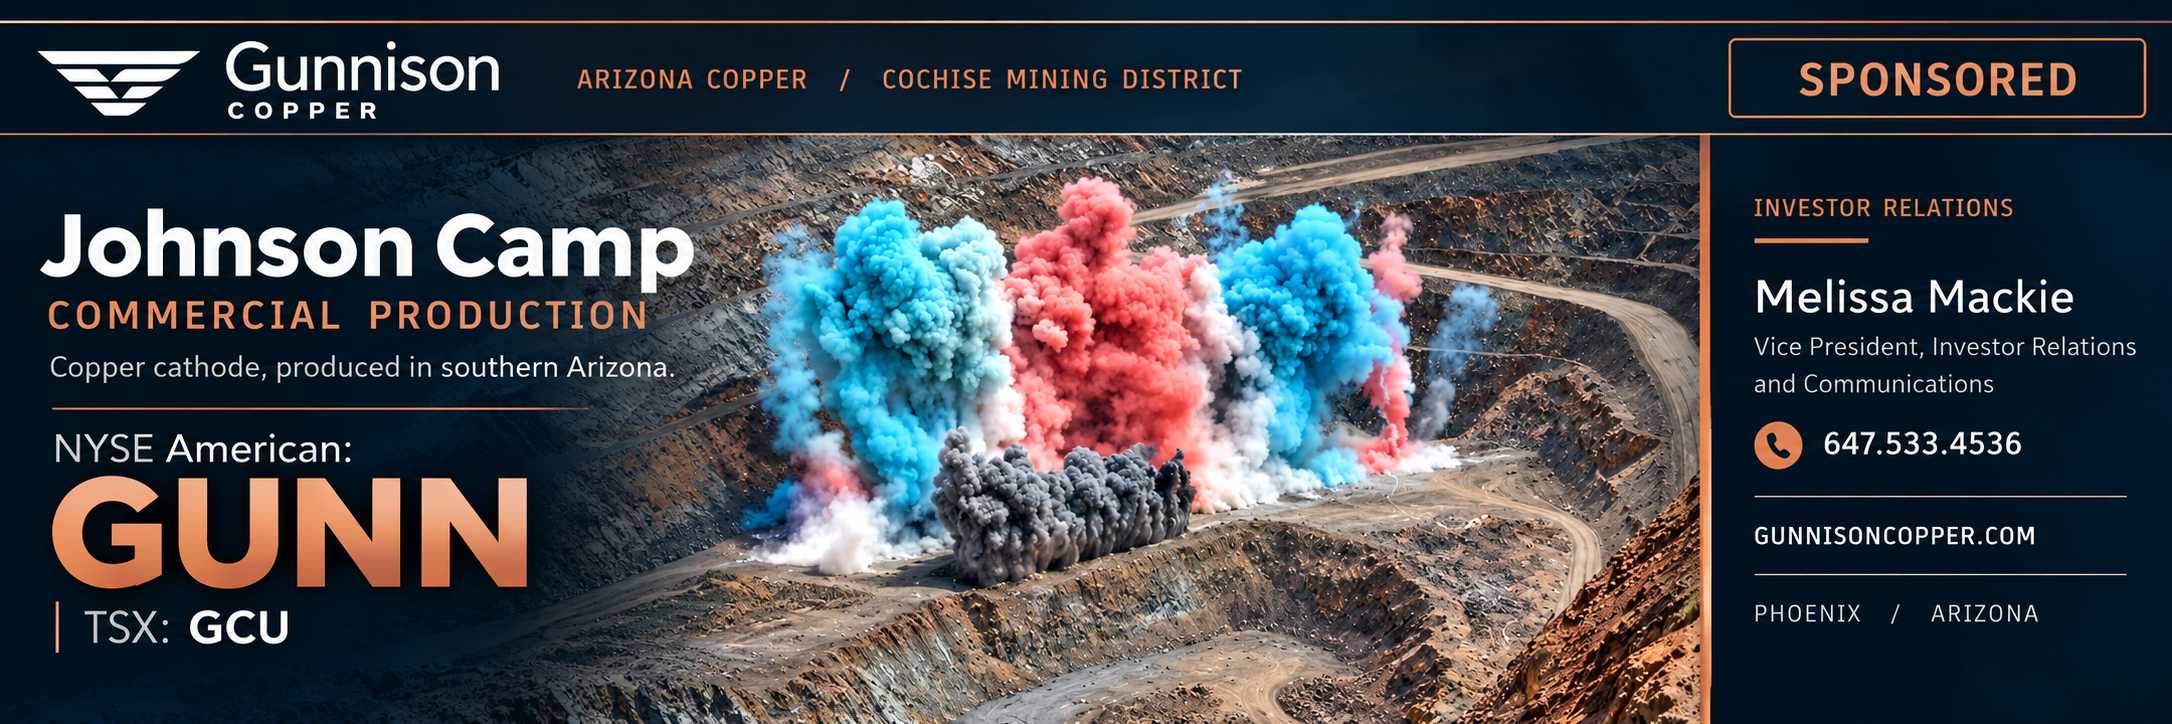
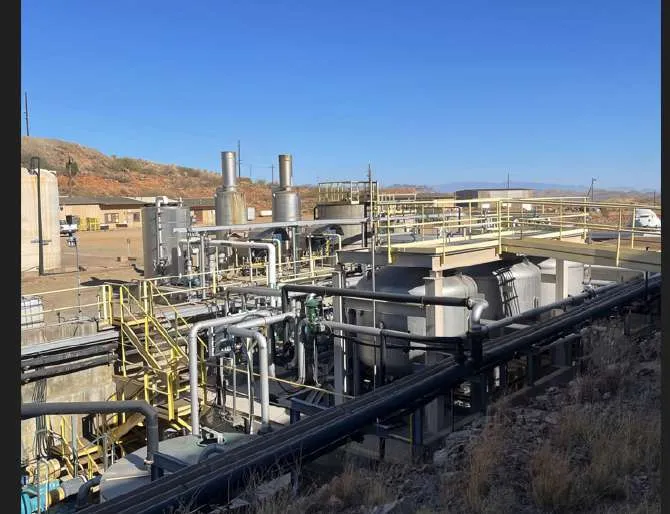
Gunnison's September 22 announcement provides a concrete starting point at Johnson Camp in Arizona. The company reported commercial production in September and describes finished copper cathode produced onsite from Arizona mineralized material at the mine, without offshore smelting or refining. The material leaves that stage as refined copper. Its subsequent conversion into a conductor is separate manufacturing work. This is an operating example of domestic cathode production, not a claim of Veramark certification or a documented route into a named customer's equipment.
The cathode's disappearance is productive. Keeping the original sheet intact would leave an easily identified object, but it would not supply the wire an electrical design needs. The manufacturer changes its form so that the copper carries current where the equipment requires it. Traceability earns its place by following that useful transformation: the buyer receives a conductor suited to its electrical job, with a production claim that still means what the manufacturing route allows.
A domestic copper strategy becomes concrete when a known American source can feed that manufacturing route. For a buyer that qualifies the material and its conversion route, domestic production adds a sourcing option; traceability preserves the origin claim that the documented route supports.
Qualified Person
Dr. Roland Goodgame, Senior VP of Project Development of the Company is a Qualified Person as defined by NI 43-101. Dr. Goodgame has reviewed and approved the technical information contained in this report.
Forward-looking information
This report contains "forward-looking information" concerning anticipated developments and events that may occur in the future. Forward looking information contained in this report includes, but is not limited to, statements with respect to: (i) the intention to deploy the Nuton® technology at the Johnson Camp mine and future production therefrom; (ii) the continued funding of the stage 2 work program by Nuton; (iii) the details and expected results of the stage two work program; (iv) future production and production capacity from the Company's mineral projects; (v) the results of the preliminary economic assessment on the Gunnison Project; (vi) the exploration and development of the Company's mineral projects; (vii) the details and timelines associated with the Company’s PFS work program; (viii) the expected results of the Company’s PFS work program; and (ix) eligibility for future tax credits.
In certain cases, forward-looking information can be identified by the use of words such as "plans", "expects" or "does not expect", "budget", "scheduled", "estimates", "forecasts", "intends", "anticipates" or "does not anticipate", or "believes", or variations of such words and phrases or state that certain actions, events or results "may", "could", "would", "might", "occur" or "be achieved" suggesting future outcomes, or other expectations, beliefs, plans, objectives, assumptions, intentions or statements about future events or performance. Forward-looking information contained in this report is based on certain factors and assumptions regarding, among other things, Nuton will continue to fund the stage 2 work program, the availability of financing to continue as a going concern and implement the Company's operational plans, , the estimation of mineral resources, the realization of resource estimates, copper and other metal prices, the timing and amount of future development expenditures, the estimation of initial and sustaining capital requirements, the estimation of labour and operating costs (including the price of acid), the availability of labour, material and acid supply, receipt of and compliance with necessary regulatory approvals and permits, the estimation of insurance coverage, and assumptions with respect to currency fluctuations, environmental risks, title disputes or claims, and other similar matters. While the Company considers these assumptions to be reasonable based on information currently available to it, they may prove to be incorrect.
Forward looking information involves known and unknown risks, uncertainties and other factors which may cause the actual results, performance or achievements of the Company to be materially different from any future results, performance or achievements expressed or implied by the forward-looking information. Such factors include risks related to the Company not obtaining adequate financing to continue operations, Nuton failing to continue to fund the stage 2 work program, the breach of debt covenants, risks inherent in the construction and operation of mineral deposits, including risks relating to changes in project parameters as plans continue to be redefined including the possibility that mining operations may not be sustained at the Gunnison Copper Project, risks related to the delay in approval of work plans, variations in mineral resources and reserves, grade or recovery rates, risks relating to the ability to access infrastructure, risks relating to changes in copper and other commodity prices and the worldwide demand for and supply of copper and related products, risks related to increased competition in the market for copper and related products, risks related to current global financial conditions, risks related to current global financial conditions on the Company's business, uncertainties inherent in the estimation of mineral resources, access and supply risks, risks related to the ability to access acid supply on commercially reasonable terms, reliance on key personnel, operational risks inherent in the conduct of mining activities, including the risk of accidents, labour disputes, increases in capital and operating costs and the risk of delays or increased costs that might be encountered during the construction or mining process, regulatory risks including the risk that permits may not be obtained in a timely fashion or at all, financing, capitalization and liquidity risks, risks related to disputes concerning property titles and interests, environmental risks and the additional risks identified in the "Risk Factors" section of the Company's reports and filings with applicable Canadian securities regulators.
Although the Company has attempted to identify important factors that could cause actual results to differ materially from those contained in forward-looking information, there may be other factors that cause results not to be as anticipated, estimated or intended. There can be no assurance that such information will prove to be accurate, as actual results and future events could differ materially from those anticipated in such information. Accordingly, readers should not place undue reliance on forward-looking information. The Company does not undertake to update any forward-looking information, except in accordance with applicable securities laws.